


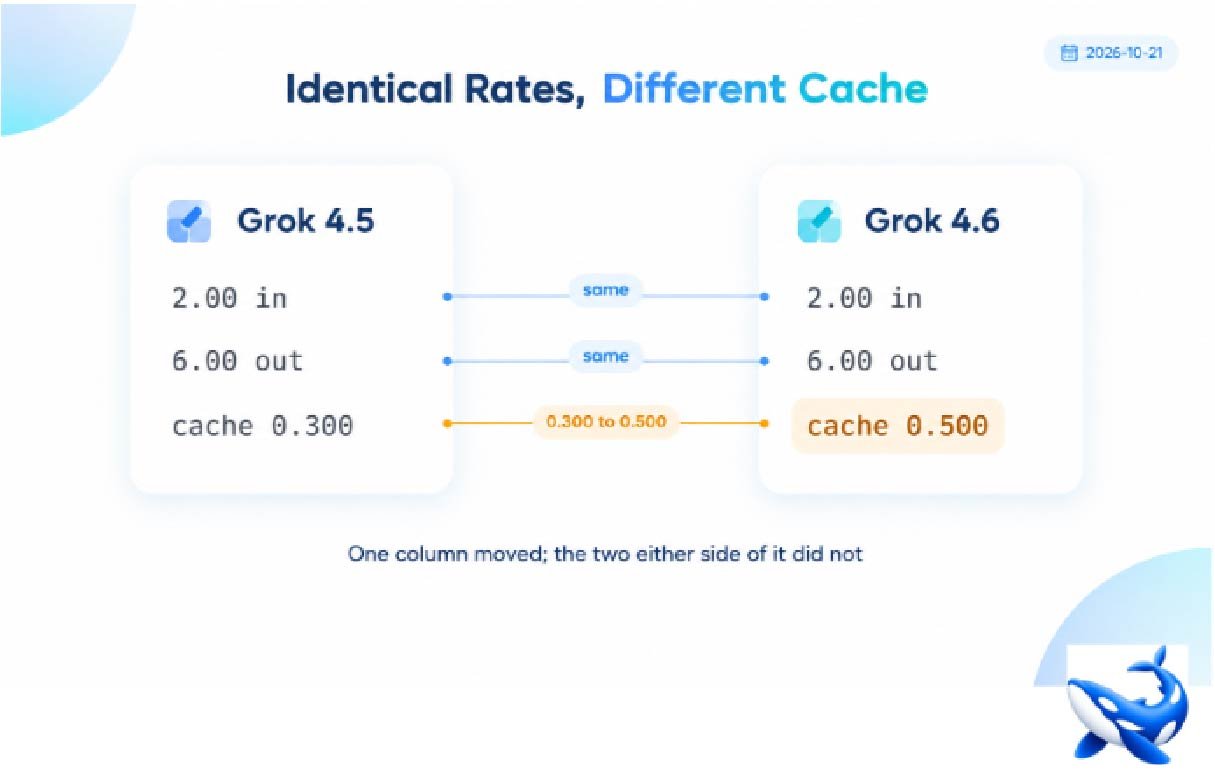
The OrcaRouter grok api page carries five rows, and two of them look like the same product at the same price.
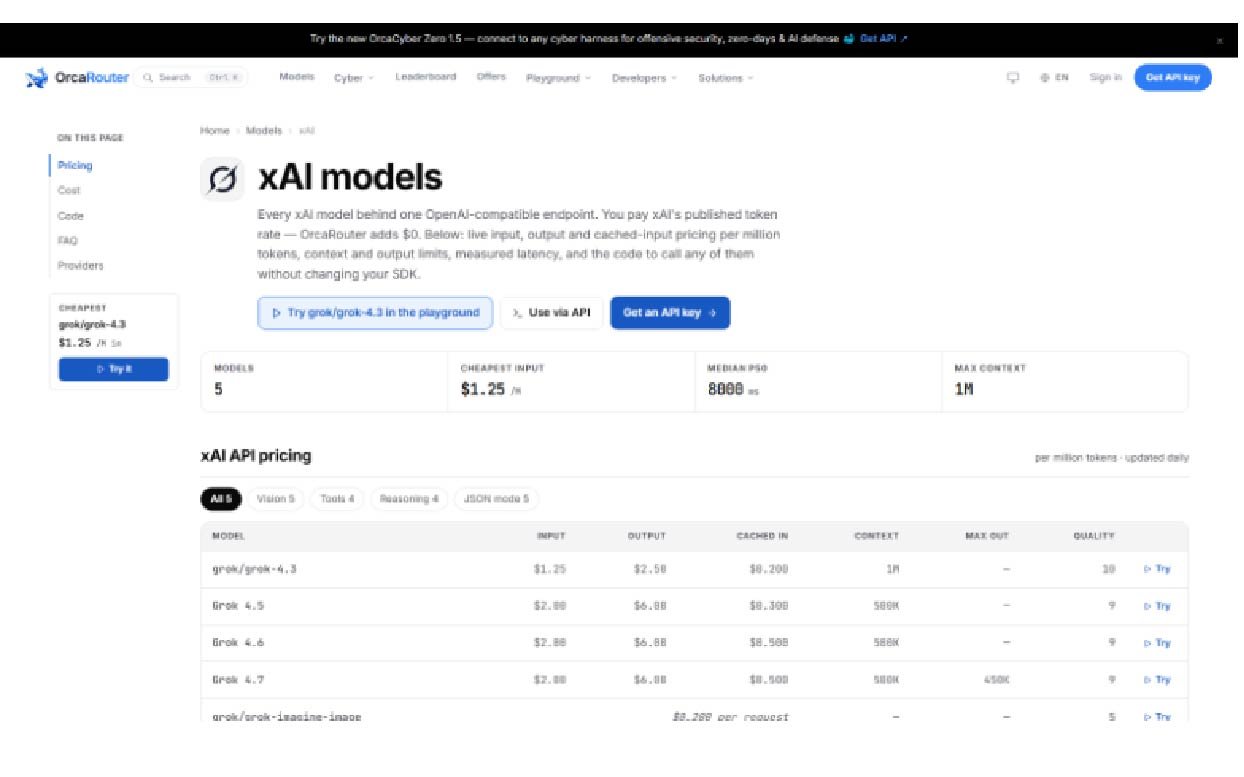
| Row | Input | Output | Cached | Context | Max out | Quality |
| `grok/grok-4.3` | $1.25 | $2.50 | $0.200 | 1M | — | 10 |
| Grok 4.5 | $2.00 | $6.00 | $0.300 | 500K | — | 9 |
| Grok 4.6 | $2.00 | $6.00 | $0.500 | 500K | — | 9 |
| Grok 4.7 | $2.00 | $6.00 | $0.500 | 500K | 450K | 9 |
| `grok/grok-imagine-image` | $0.200 per request | — | — | — | — | 5 |
Grok 4.5 and Grok 4.6 list $2.00 in and $6.00 out — identical to the cent. Their context windows match at 500K. Their quality scores match at 9. And their cached-input prices differ: $0.300 against $0.500 [VENDOR: the provider’s published rates, passed through with $0 markup; the columns are our own page data].
That is the only column in which they differ, and it moves in the direction nobody expects. A newer row charges two thirds more for a cache hit than the row above it, while the two rates a reader actually scans have not moved at all.
What a cache price increase means
The cached-input price is the rate at which repeated prefix is billed. It is not the price of the model, and it is not a fee. It is a discount rate expressed in dollars, and on this page it has moved from 15 percent of input ($0.300 against $2.00) to 25 percent ($0.500 against $2.00).
Read as a discount, 4.5 offers a 6.7× reduction and 4.6 offers 4×. Read as a bill, a million cached tokens costs $0.300 on one row and $0.500 on the other.
Both readings are correct, and the second one is the one that lands on an invoice. For a workload that repeats a large prefix — a system prompt, a tool schema, a retrieved corpus — the cost of that repetition rose by $0.200 per million tokens between the two rows, which on a billion cached tokens a month is $200 [OURS arithmetic].
That is not a large number in absolute terms, and it is not the point. The point is that it is invisible in the two columns a comparison shopper reads. An evaluation that compares Grok 4.5 and 4.6 on input and output rates concludes they are identical products. The cache column says they are not.
Why the two same-named columns are not the same thing
The deeper question is why an unchanged headline rate and a changed cache rate can coexist, and the honest answer is that the page does not say. There are at least three shapes this could take, and the table cannot distinguish them.
The newer model might cache a different portion of the request — a longer prefix, a different boundary. The implementation behind the cached rate might be a different product with different economics. Or the rate might simply have been re-set, with the input rate held flat to keep the headline comparison clean. All three produce the table in front of you.
What the table does establish is that a provider can hold two of its three rate columns constant across a model generation and move the third. Any cost model that assumes a provider-wide cache ratio — and the ones built from a single row usually do — is assuming something this catalogue does not guarantee.
The rest of the catalogue shows the same thing in a different register. `grok/grok-4.3` caches at $0.200 against $1.25 input: 16 percent. Grok 4.7 caches at $0.500 against $2.00: 25 percent. Three different ratios across four paid rows [OURS], and a reader who carries one of them forward will be wrong on two.
The other inversion: the cheapest row is the flagship
One structural fact about this page deserves mentioning alongside the cache story, because it explains why the comparison above matters more than it looks.
`grok/grok-4.3` is simultaneously the cheapest input rate on the page ($1.25) and the highest quality row (10 of 10) [OURS]. Every other row lists $2.00 input and scores 9. So the row with the flagship score is also the row at the bottom of the price ladder, and it is the only row carrying a 1M context window — the newer 4.5, 4.6 and 4.7 rows all sit at 500K.
That is a genuine inversion of the usual catalogue shape, and it has a practical consequence for anyone using cache price as a tiebreaker. The tie you are breaking — Grok 4.5 versus 4.6 — is a tie between the two middle rows. The row above them wins on price, on window and on score at once, and it also carries the second-lowest cache price on the page.
So the interesting question is not which of 4.5 and 4.6 to cache on. It is whether the newer rows justify their position at all, and the page’s own columns say they do not, on price, window or score. What they bring is the version itself — a dated build with its own behaviour — and the table is right not to pretend that is a column.
The blank max-out column and what it means
Three of the five rows read a dash in the max-output column: grok-4.3, Grok 4.5 and Grok 4.6. Only Grok 4.7 fills it, at 450K, and the image row’s cells are shaped differently altogether.
A dash there is not a zero and not an unlimited ceiling. It means the page does not state a value for that row, and the practical consequence is that any planner which reads that column has nothing to read for three quarters of the catalogue. For a workload that needs a guaranteed output ceiling, three of the four text rows require a question to the provider rather than a lookup in the table.
There is a second reading worth noting, less comfortable but more useful: Grok 4.7 is the only row where the page states an output ceiling, and it is also the only row where the ceiling is stated as a large fraction of the context window. 450K of a 500K window is 90 percent — the same shape as the Kimi K2.7 Code row, where max output equals context. Catalogues that state a ceiling tend to state a generous one; catalogues that leave it blank are telling you they have not published the number, not that the number is small.
How to read a cache column in a comparison
Three checks that would have caught the difference above.
Compare the cached price in dollars, not as a percentage. Grok 4.5’s $0.300 and Grok 4.6’s $0.500 are the numbers that appear on a bill. The percentages (15 versus 25) are a useful summary and a dangerous substitute.
Assume the cache ratio moves independently of the rate card. On this page it did, across one generation, in the direction that costs more. A model that holds its headline rates flat is not committing to hold its cache rate flat.
Put the whole row next to the whole row. The 4.5-versus-4.6 comparison is only interesting because two of the columns match and the third does not. A comparison that ranked by a single column — price, or context, or score — would have missed the only difference between the rows and the only row on the page that beats both of them.
Sourcing note: every rate, cache price, context window, max-output value and score quoted here is read from the OrcaRouter Grok provider page on 2026-10-21. The rates are the provider’s published prices passed through with $0 markup [VENDOR]; the row structure, the cache-ratio arithmetic and the cross-row comparisons are ours [OURS]. The monthly figure for a billion cached tokens is our own arithmetic. The 0-to-10 quality scores are our own composite, not a third-party benchmark. No third-party evaluation figures are used. Rates change; all values checked 2026-10-21.
